

Published September 8, 2026
First Friday Update September 4, 2026

Colorado Springs Housing Is Soft. It Still Isn’t 2011.
First, my apologies for delivering the First Friday Update on a Tuesday. I hope everyone had a great Labor Day weekend and found some time to enjoy family and friends.
Now, let’s talk about the market—because August gave us some genuinely interesting numbers.
Inventory May Finally Be Leveling Off
Active inventory normally increases going into a weekend which is why I liked to do these updates on Friday. I peeked at the inventory Friday at it was just barely over 2,800 existing single family homes in El Paso County. This is flat over last month. By Tuesday morning, that number had dropped to 2,744 as a few of these listings went under contract or fell off the market in other ways.
Key point, inventory has been roughly flat over the past month.
That is the most encouraging signal we have seen in a while. If inventory continued climbing through the fall and winter, sellers could be facing a difficult spring. A slowdown in new listings suggests the market may finally be returning to a more normal seasonal pattern.
One month does not establish a trend, but this is worth watching.
Closed Sales Tell Only Half the Story
According to Pikes Peak MLS data, August produced:
- 985 closed sales
- A median sale price of $470,000
- A sold-to-original-list-price ratio just under 98%
For comparison, August 2025 recorded 1,039 sales and a median price of $480,000. In August 2024, the median was $490,000.
Colorado Springs prices have spent most of the period since 2022 hovering just below $500,000. That means our market has not suffered a dramatic price collapse—but it also has not made meaningful progress in several years.
This median number is also absolutely skewed by a relatively healthy high end market and a disproportionately unheathly lower end. We've got high end sales propping up the median price while entry level buyers struggle to get in at all.
Closed sales, however, show us only the houses that successfully found buyers.
In August, the MLS also recorded 623 canceled or expired listing records. Five years ago, that number was approximately 190.
Year to date, we have seen 4,059 canceled or expired listings. During the same period in 2011, the MLS recorded 4,995.
A word of caution: those are listing records, not necessarily unique houses or sellers. A house may expire, be relisted, and appear more than once in the data. Even with that limitation, the increase is significant. It tells us that a growing number of sellers are testing the market and failing to get the price or terms they expected.
The sold listings show us the winners. The canceled and expired listings show us how difficult the competition has become.
Are 12% of Colorado Sellers Underwater?
A statistic making the rounds says approximately 12% of Colorado sellers are “underwater” at their current asking prices.
That description is not accurate.
Parcl Labs reports that approximately 11.8% of active Colorado listings are priced below what the current owner paid for the property. That is a meaningful sign of seller stress, but it does not tell us whether those owners owe more than their properties are worth.
A seller may have made a large down payment, paid cash, or reduced the mortgage balance over several years. Some of these properties are also investor-owned rather than owner-occupied.
The accurate conclusion is this:
Roughly 12% of active Colorado listings are asking less than the current owner’s purchase price—not that 12% of sellers are underwater on their mortgages.
Those sellers may still lose money after commissions, concessions and closing costs. But accepting a loss on a sale is very different from being unable to pay off the mortgage.
That distinction matters when comparing today with the housing crisis.
Today’s Market Is Not 2011
In the third quarter of 2011, approximately 20% of Colorado’s mortgaged properties had negative equity. In the Colorado Springs area, the figure was nearly 22%.
Today, ATTOM reports that 2.8% of Colorado mortgages are seriously underwater, meaning the combined loan balance is at least 25% greater than the estimated property value. This puts Colorado right in the middle of the nation in this statistic with states like Louisiana leading the way at over 11%.
These figures are not directly comparable. The 2011 figure included any amount of negative equity, while ATTOM’s current measurement begins only when the borrower is at least 25% underwater.
Unfortunately, I have not found a current, publicly available Colorado figure using exactly the same definition CoreLogic used in 2011. Anyone presenting 20% versus 2.8% as a perfect comparison is overstating the evidence.
Even so, the available data makes one thing clear: Colorado is nowhere near the negative-equity conditions experienced during the housing crisis of 2008. This is true because prices have not fallen drastically and because rising rates make holding onto existing loans favorable.
For historical context, Colorado’s overall negative-equity rate fell to approximately 14% in early 2013 and 9.5% by that summer. In other words, the closest historical period to a 12% statewide negative-equity rate was probably the spring of 2013—when the market was already recovering from the crash.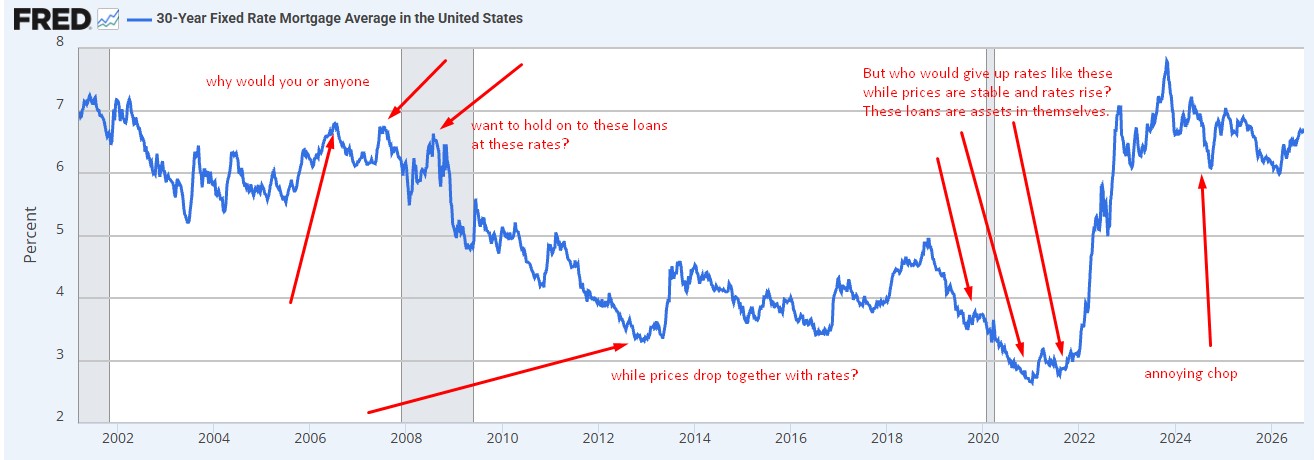
Why the Mortgage Matters More Than the Price
Look at the graph above and think about it plainly. The critical difference between then and now is not simply the value of the house. It is the structure and cost of the mortgage attached to it.
Many buyers who purchased near the 2006 peak had mortgage rates in the 6% to 7% range. When values fell, they could not sell or refinance without bringing money to closing. Many also had riskier loan structures like adjustable rates that climbed while their value dropped. Imagine that feeling, you payment rises while your equity nose dives.
Big difference between today and 2007 is this. Today approximately 4% of existing mortgages are adjustable rates. End of 2007 that number was 22%!
Today, approximately half of outstanding residential mortgages have rates below 4%, and about 69% have rates at or below 5%, according to the Federal Housing Finance Agency’s National Mortgage Database.
Meanwhile, the average new 30-year mortgage was approximately 6.7% in early September, according to Freddie Mac.
That creates what I've heard called a “coffin loan”: owners may dislike their current house, but they might just die in it rather than lose their 2.x% rate—or at least until a major life event forces a move.
Low-rate owners generally have:
- Smaller monthly payments
- More principal reduction with each payment
- Greater flexibility to withdraw a listing
- Less pressure to accept a deeply discounted offer
That does not prevent prices from falling. It does, however, reduce the probability of widespread forced selling.
In Colorado Springs, that pressure is currently appearing more often as expired listings, cancellations, price reductions and seller concessions—not foreclosures.
Distress Is Increasing, but Context Matters
I am seeing more distressed situations than I did a few years ago. That deserves attention.
However, the most recent El Paso County Public Trustee foreclosure data I could reliably review did not show a surge beyond last year’s levels. We should continue monitoring those filings, but the current numbers do not support comparisons with 2008.
Going from almost no distressed sales to some distressed sales can feel alarming. In many respects, though, it is a return to a normal housing market.
A healthy market occasionally includes foreclosures, short sales, investor losses and owners who must sell at an inconvenient time. Zero distress was never a sustainable baseline.
There Is Not One National Housing Market
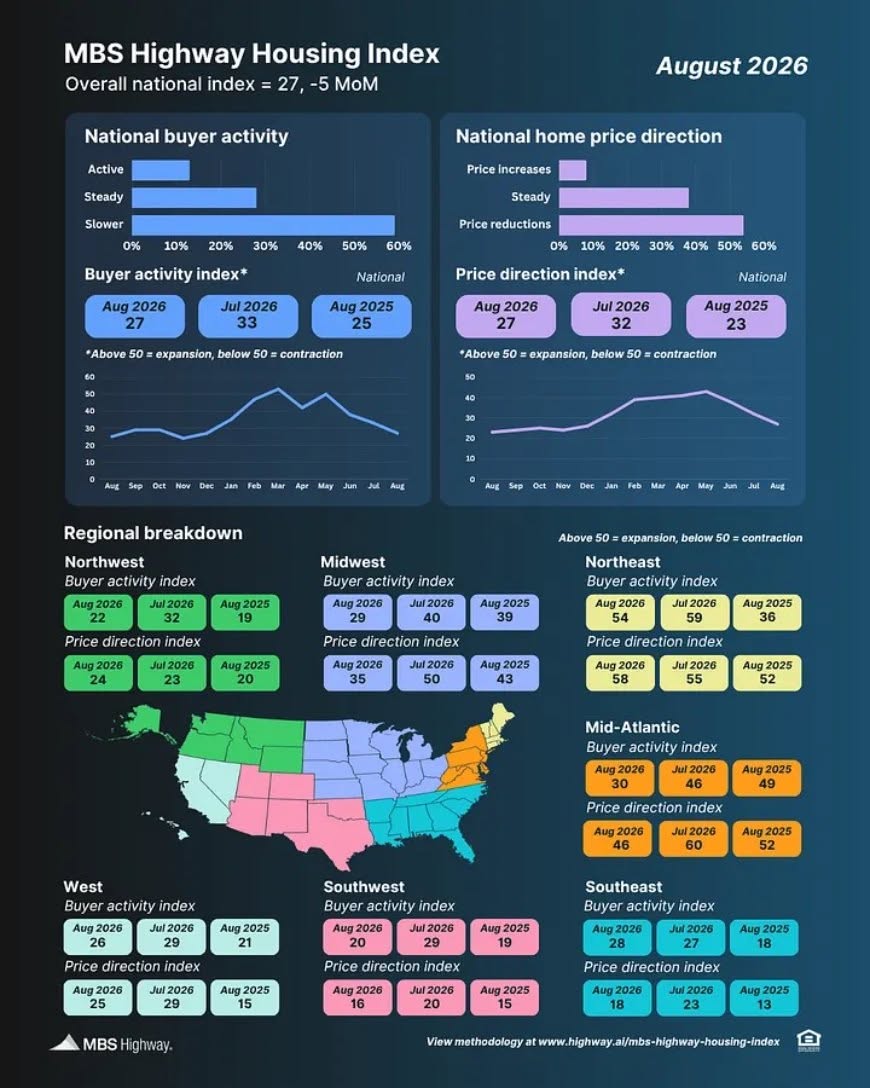
Another reason housing headlines are so confusing is that the country is moving in several directions at once.
For the visual above 50 is the magic number. Above that you have expansion, below that contraction.
Many Western and pandemic-boom markets are struggling with affordability, increased inventory and price resistance. Meanwhile, parts of the Midwest and Northeast continue to experience tighter supply, stronger price growth and bidding wars.
I believe part of this is an unwind of the pandemic migration cycle.
In 2020 and 2021, remote work allowed buyers to leave expensive employment centers and compete aggressively in markets such as Colorado Springs, Denver, Austin and other secondary cities. That demand pushed prices far beyond what local incomes alone could comfortably support.
Today, employers are pulling more workers back toward offices, and some buyers are returning to larger job centers. At the same time, the markets that experienced the largest pandemic-era gains are working through the affordability problem that followed.
That does not mean Colorado Springs is broken. It means our market is correcting an unusually rapid run-up while other regions are at different points in their cycles.
The blow off we're seeing here, in Denver, in Austin and across a good chunk of America is on the one hand. On the other hand a million over listing is nothing weird in San Francisco. Oakland has areas today where 23% over list is normal. Chicago is appreciating at about 5% year over year. The north east is seeing price gains and multiple offers as the norm. Oklahoma City and rural Tennessee are appreciating just fine. This isn't a national housing crash, this is a regional correction based on the concept of "easy come, easy go".
What This Means for Colorado Springs
This is a softer and more selective market—not a replay of 2011.
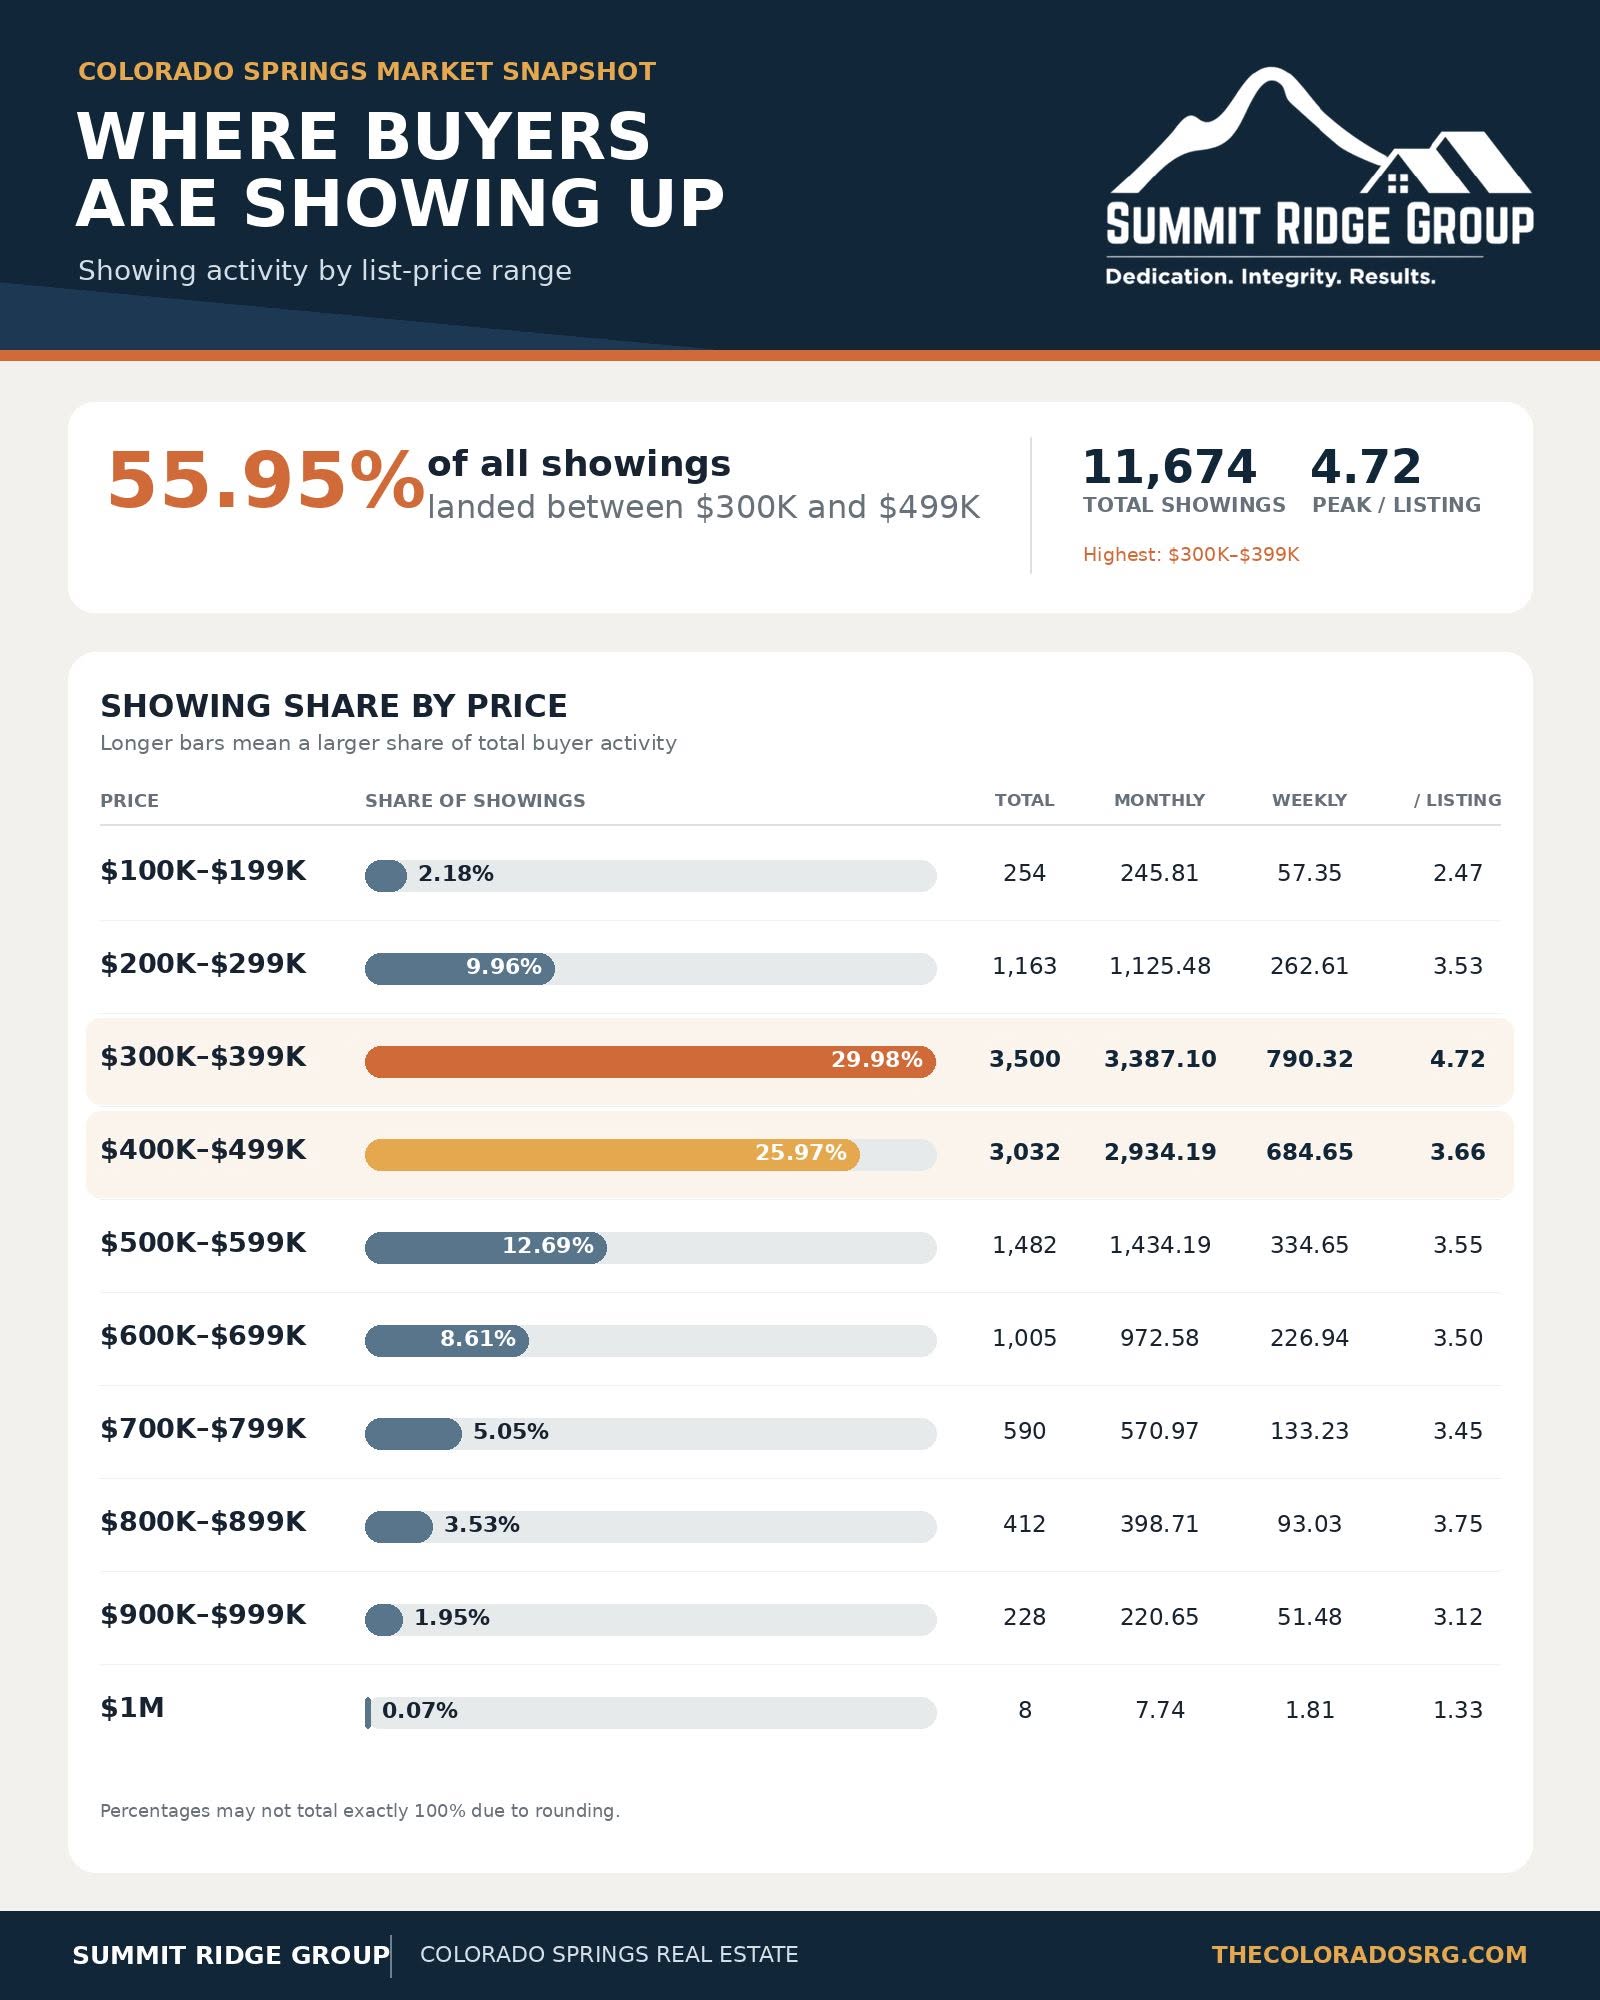
Showing activity locally is the slowest I've seen it in 13 years.
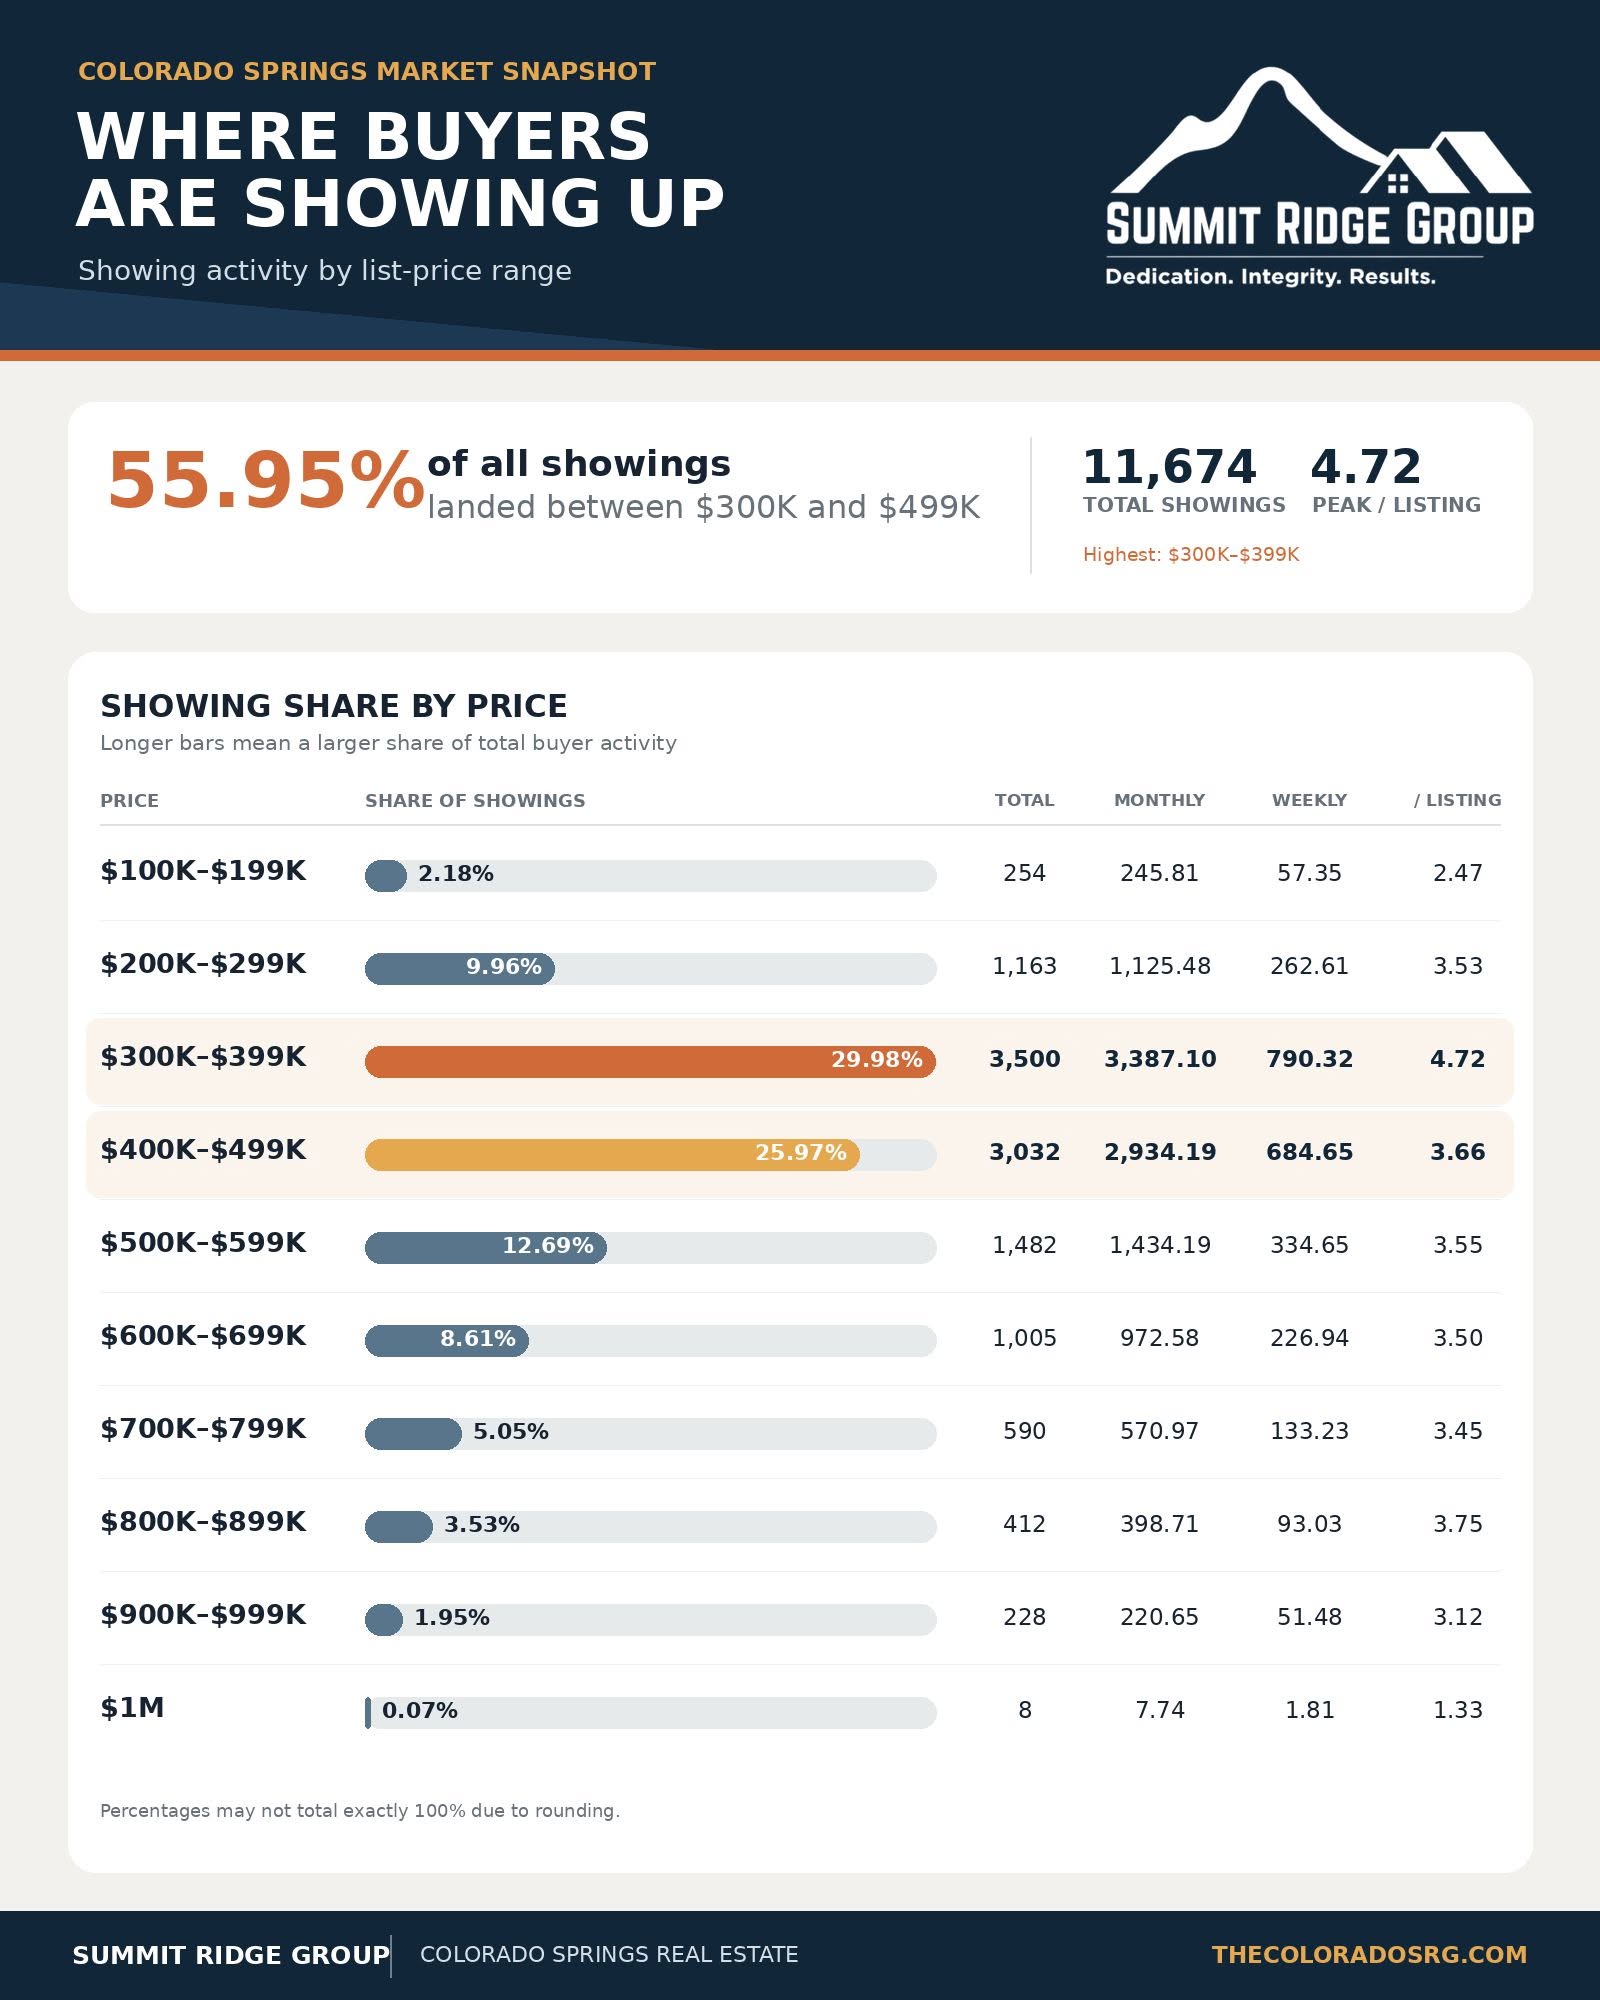
The column on the right is showings per listing per month. In 2021 we would get that number of showings by lunch and have it sold by dinner.
For sellers, aspirational pricing is becoming increasingly expensive. The first few weeks matter, and buyers have little patience for houses that need work but are priced as though they do not. Sellers who believe themselves to be in a seller's market contribute to the cancelled/expired number rather than the closed data.
For buyers, negotiating power has improved significantly. Depending on the property, that may mean a lower price, closing-cost assistance, repairs or a mortgage-rate buydown. In my recent experience sellers that are able to are generally willing to bend over backwards to close deals.
For owners with low mortgage rates, staying put remains financially attractive. That helps explain why we are seeing listings canceled rather than a wave of forced sales.
The market is uncomfortable, but discomfort and collapse are not the same thing.
As always, national headlines can provide context—but your neighborhood, price range and property condition will determine what the market actually means for you.
Be fearful when others are greedy and greedy when others are fearful. Real estate is a long game and chances are popping up all over the place that will probably make you look pretty smart in 2036 and 2046 and so on.