

Published October 4, 2026
First Friday Update October 2, 2026

Welcome to the fourth quarter!
Will Bo Nix save the housing market? Does it even need saving? If a train leaves Seattle traveling east at 50 mph, why is the color purple so luxurious?
These are the questions.
Look—the market is. Whether it’s good or bad depends on which side of it you’re on, what you’re trying to accomplish, and the circumstances surrounding your move. My goal with these updates is to remain reasonably objective and tell you the truth as I see it.
One thing that would make this market meaningfully worse is a continued buildup of inventory. From that perspective, we have some good news.
There are currently 2,744 existing single-family homes for sale in our local market. That’s fewer than last month, continuing the normal seasonal trend of inventory declining as we move toward the holidays. That matters because it tells us sellers aren’t piling onto the market or panic-selling into winter, which could put additional downward pressure on prices.
Inventory remains slightly above last year and significantly higher than it was in 2024. Two years ago, only 1,941 existing homes were available. Today’s inventory is roughly 41% higher.
The short version: inventory has been relatively stable over the past year and is plentiful across most of the market. There are still pockets where demand exceeds supply, but those tend to be specific neighborhoods, price points, or property types rather than the market as a whole.
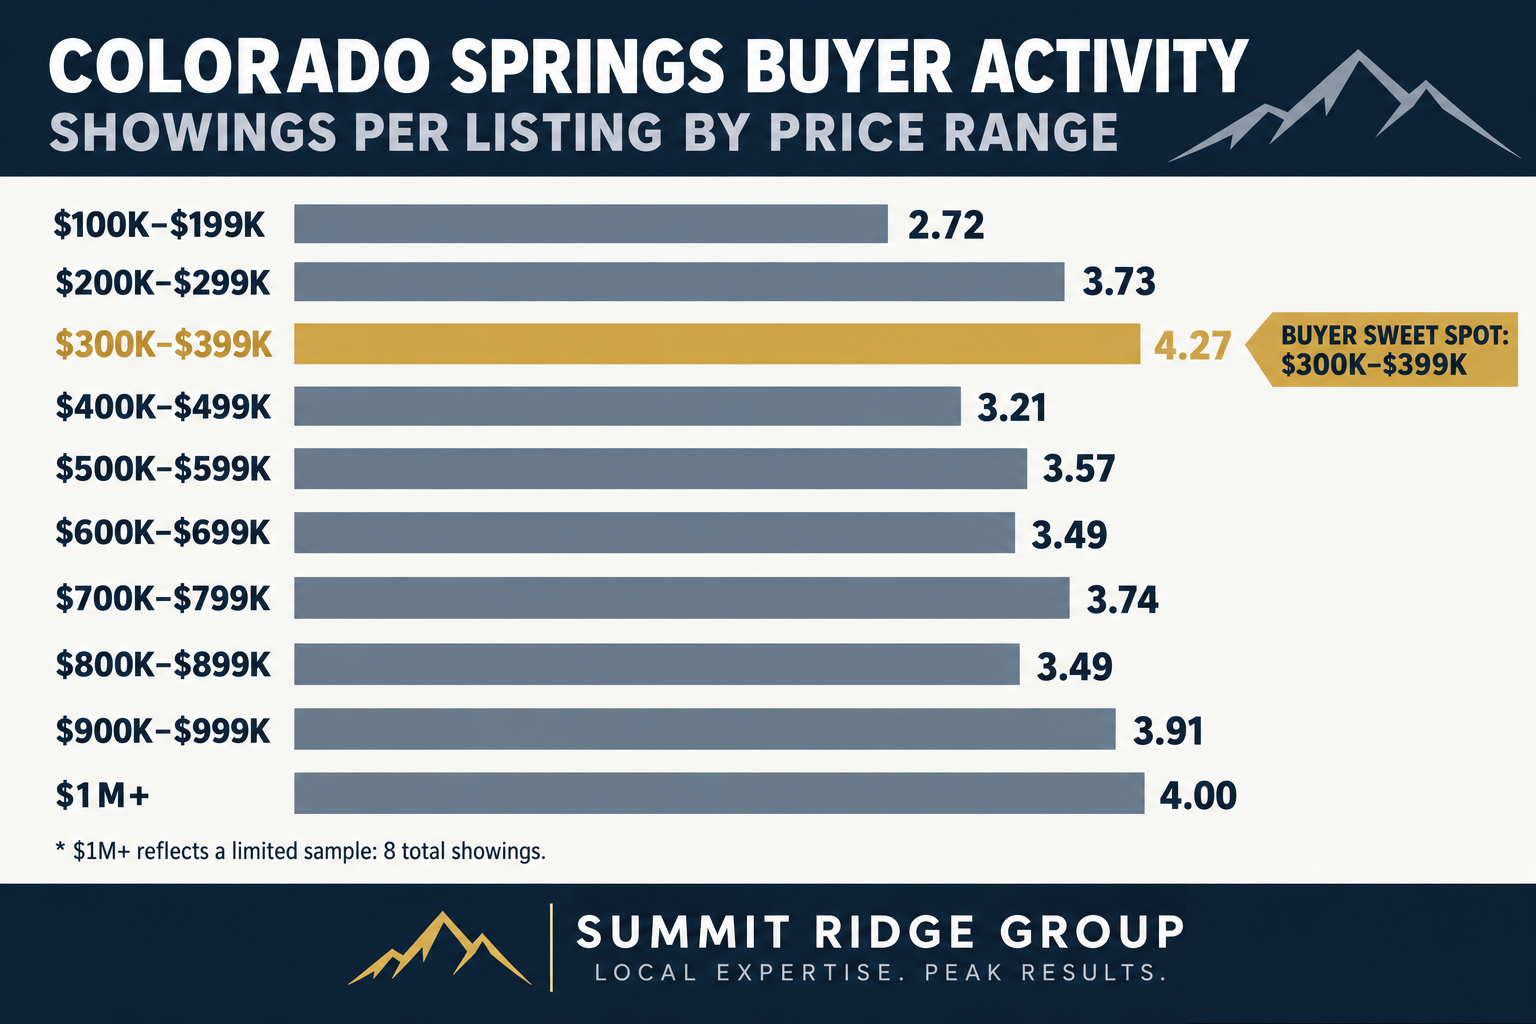
Showing activity in September wasn't exactly amazing and shows a continuation of this years trend. This is showing you the total number of showings per listing for the whole month of September. So if you're getting about a showing a week you're doing good, my guy!
A total of 885 homes sold through our local MLS in September, with a median sale price of $475,000.
Since mortgage rates jumped during the summer of 2022, our median sale price has mostly bounced around between $450,000 and $500,000. We have not experienced a meaningful correction in that headline number. Median price certainly doesn’t tell the full story across every segment of the market, but it does summarize the sideways chop pretty well.
Median days on market has leveled out at 36 days—for the homes that actually sell.
That isn’t a particularly remarkable or alarming number. However, remember that closed-sale statistics only describe the properties that successfully found buyers. The homes that sit, expire, withdraw, or repeatedly reduce their prices tell an entirely different part of the story. I’ll touch on that shortly.
Here’s how September compares with prior years:
- September 2025: 1,029 sales | $477,500 median price | 39 median days on market
- September 2024: 943 sales | $482,000 median price | 28 median days on market
- September 2023: 970 sales | $478,000 median price | 19 median days on market
- September 2022: 1,298 sales | $460,000 median price | 17 median days on market
September 2022 marked the beginning of the “marry the house, date the rate” era. Prices initially dropped as the market absorbed a dramatic increase in borrowing costs, which began around June of that year. Remarkably, prices then stabilized and recovered.
The aggressively marketed 2-1 buydowns provided temporary payment relief, but for buyers who were counting on a quick return to ultra-low mortgage rates, that gamble has not aged particularly well.
The last time our market recorded fewer than 900 September sales was 2013. That year, we had 843 closings at a median price of $215,000 and a median of 45 days on market.
Fun fact: September 2013 is also when I received my real estate license.
So yes, the market feels slow because it is slow—but it continues to persist.
One major factor I continue watching is the relationship between the M2 money supply and housing prices. It isn’t a perfect one-to-one relationship, and M2 certainly doesn’t explain the entire housing market, but the long-term connection is difficult to ignore.
M2 has quietly climbed beyond its post-COVID high and continues moving upward. My read is that policymakers understand a rapid correction—and the resulting deflation in asset prices—would likely cause more economic damage than allowing steady inflation to continue, even if it remains above target.
Lookie here, Linda:
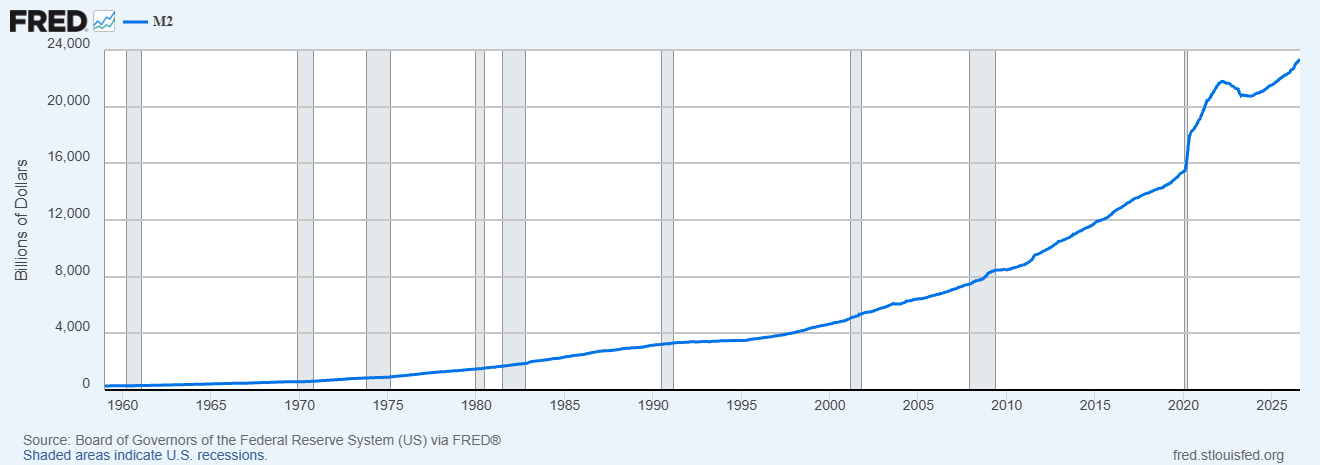
Here is your M2 money supply since 1959 and compare that to the national average sold price. Sorry median data only available for new builds not the whole market.
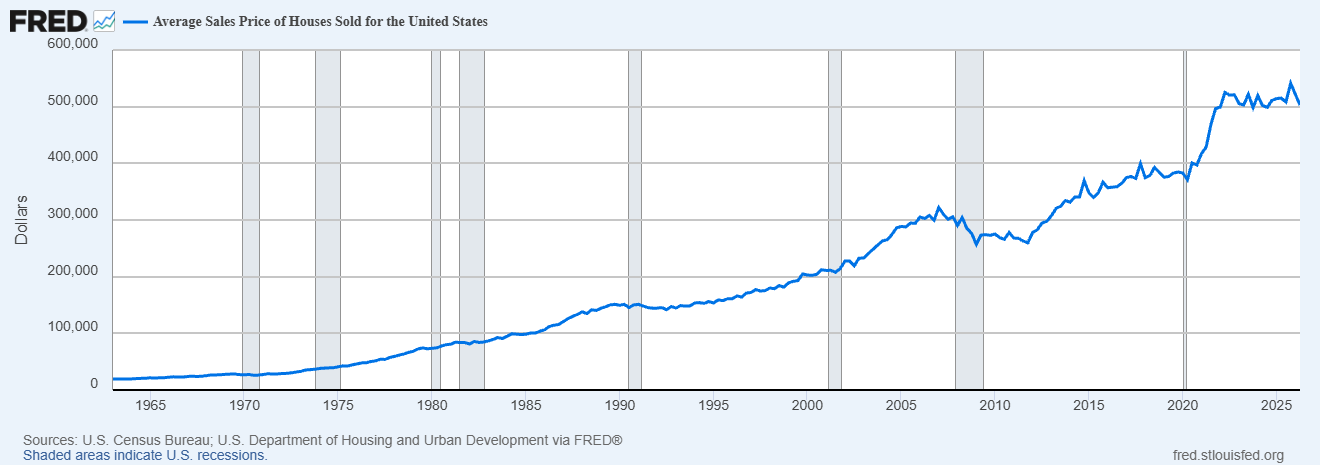
The M2 graph is basically just a smoothed out graph of housing prices.
Here’s my hot take—and I may be completely wrong.
In the short term, I expect more pain: more foreclosures, more fire sales, and more discouraging economic news. I would not be surprised to see a weak housing market persist for another three or four years.
I would not buy anything speculatively with the plan of holding it for a year or two and simply hoping someone pays me more for it. I wouldn’t do that today, and frankly, I don’t think that has ever been a sound investment strategy. That’s speculation, not investing.
What I would do—and what I am actively doing—is look for genuinely good opportunities that make sense on today’s numbers and that I would be comfortable owning for at least ten years. If the deal only works because rates must fall, rents must surge, or another buyer must bail me out in two years, then it doesn’t actually work.
Now look at these two graphs together.
The M2 graph shows the long-term monetary backdrop: governments expanding the money supply as they finance deficits, wars, growing obligations, and—arguably—the decline of aging empires.
The housing-price graph tells the more emotional, short-term story. It shows fear and FOMO. It shows reactions to rising rates, falling rates, inventory gluts, and housing shortages.
It captures the frantic buying of the COVID era and the sideways chop that followed—the same chop reflected in our local median sale prices over the past four years.
The M2 graph is the smoother long-term trend. The housing graph is the volatile path we take along the way.
That doesn’t mean housing prices can’t fall, or that every property will be a good investment. It means I’m far more interested in buying the right asset at the right price with a long time horizon than trying to predict what the market will do over the next 12 or 24 months.
Trying to call the exact top or bottom of any market is mostly a game of chance. Finding a good deal based on your needs, the available data, and identifiable trends is much closer to basic math.
Whenever the market gets hectic, confusing, or just plain weird, I come back to Warren Buffett’s famous advice:
“Be fearful when others are greedy and greedy when others are fearful.”
Based on what I’m seeing today, I believe it is time to be cautiously greedy.
The word cautiously is doing a lot of work there.
Before we get too excited (or more likely fall asleep reviewing them) about the closed-sale numbers, let’s talk about the segment of the market that never made it to the closing table.
In September, 683 properties were canceled or expired from our local MLS without selling. In an almost unbelievable statistical coincidence, exactly 683 properties also canceled or expired in September 2025.
At first glance, that sounds like nothing changed. But last September, 1,029 homes sold. This September, only 885 sold.
Put those numbers next to each other and we went from roughly 66 canceled or expired listings for every 100 closings last year to approximately 77 for every 100 closings this year.
Now compare that with 2021.
During the peak tail-wagging-the-dog insanity of that market, only 131 properties failed to sell during September. Today’s number is more than five times higher.
The last September in which we saw failed-listing volume above today’s level was 2010, when 1,018 properties canceled or expired. Remarkably, even 2011 and 2012—the hangover years following the housing crash—recorded fewer failed listings than we saw in either 2025 or 2026.
National data confirms that Colorado Springs is not operating in a vacuum.
Redfin found that nearly 85,000 listings were removed from the market nationally in September 2025, a 28% increase from the previous year. Delistings represented 5.5% of all listings—the highest September share in its data going back to at least 2016.
By April 2026, the national delisting share had reached 5.8%, tying the highest level recorded since the initial pandemic shutdown.
However, the latest national data also provide an important counterpoint. Realtor.com reported that approximately 5.6% of listings were delisted in September 2026, essentially unchanged from last year. In other words, failed listings remain elevated nationally, but there is no evidence that they experienced another nationwide spike this September.
What did deteriorate nationally was seller pricing and buyer demand. More than 20% of active listings received a price reduction in September—the highest September share since 2018—and the number of homes under contract fell 4.1% from last year. Denver had price reductions on 31.5% of its listings, one of the highest shares among the country’s largest markets.
So, what does all of this tell us?
The undiplomatic answer is that a lot of sellers are delusional.
The more precise answer is that buyers and sellers currently disagree about value—and many sellers are financially strong enough to refuse the market’s answer.
Some owners still “know what their home is worth” because they remember what their neighbor received during the frenzy of 2021. They want yesterday’s sale price without yesterday’s mortgage rate, buyer competition, or affordability. When today’s buyers refuse to cooperate, those sellers cancel the listing and wait.
Others are simply testing the market. They would happily sell if someone paid their aspirational price, but they do not actually need to sell. If the market declines to meet their number, they can keep the home, rent it, or try again next spring.
That distinction matters because today’s failed listings do not necessarily represent distressed inventory.
American mortgage holders collectively possess a record $18 trillion in home equity. Intercontinental Exchange estimates that 47.5 million mortgage holders have approximately $11.7 trillion in tappable equity—an average of about $212,000 per borrower. That enormous equity cushion gives many owners the ability to reject an offer, withdraw the property, and wait.
There is real financial stress developing around the edges. National foreclosure filings increased 21% during the first half of 2026, and Colorado foreclosure activity increased 57% from the previous year. But only 0.16% of all U.S. housing units received a foreclosure filing during that period. Distress is rising; widespread forced liquidation is not yet occurring.
That is the critical difference between today and 2010.
In 2010, many sellers had to sell. Today, many sellers would merely like to sell—if the price is high enough.
These are also the listing appointments where I explain what the data support, realize the seller does not actually want the market’s answer, and leave with no intention of adding them to my follow-up list.
If the entire strategy is to price a home $50,000 too high and “see what happens,” we already know what happens. The market does not care what your neighbor received in 2021.
For buyers and investors, the opportunity is not simply to chase every stale or canceled listing. The opportunity is to identify the difference between a seller who wants to sell and one who needs to sell.
A vacant property, an inherited home, an expensive repair, a relocation, mounting carrying costs, financial pressure, or several unsuccessful listing attempts can eventually create real motivation. That is where patience, research, and conservative numbers can produce an actual deal.
Be greedy when others are fearful—but remember that greed without discipline is just another form of stupidity.
That is why my position today is not blindly bullish. It is cautiously greedy.