
Published May 1, 2026
First Friday Update May 1, 2026


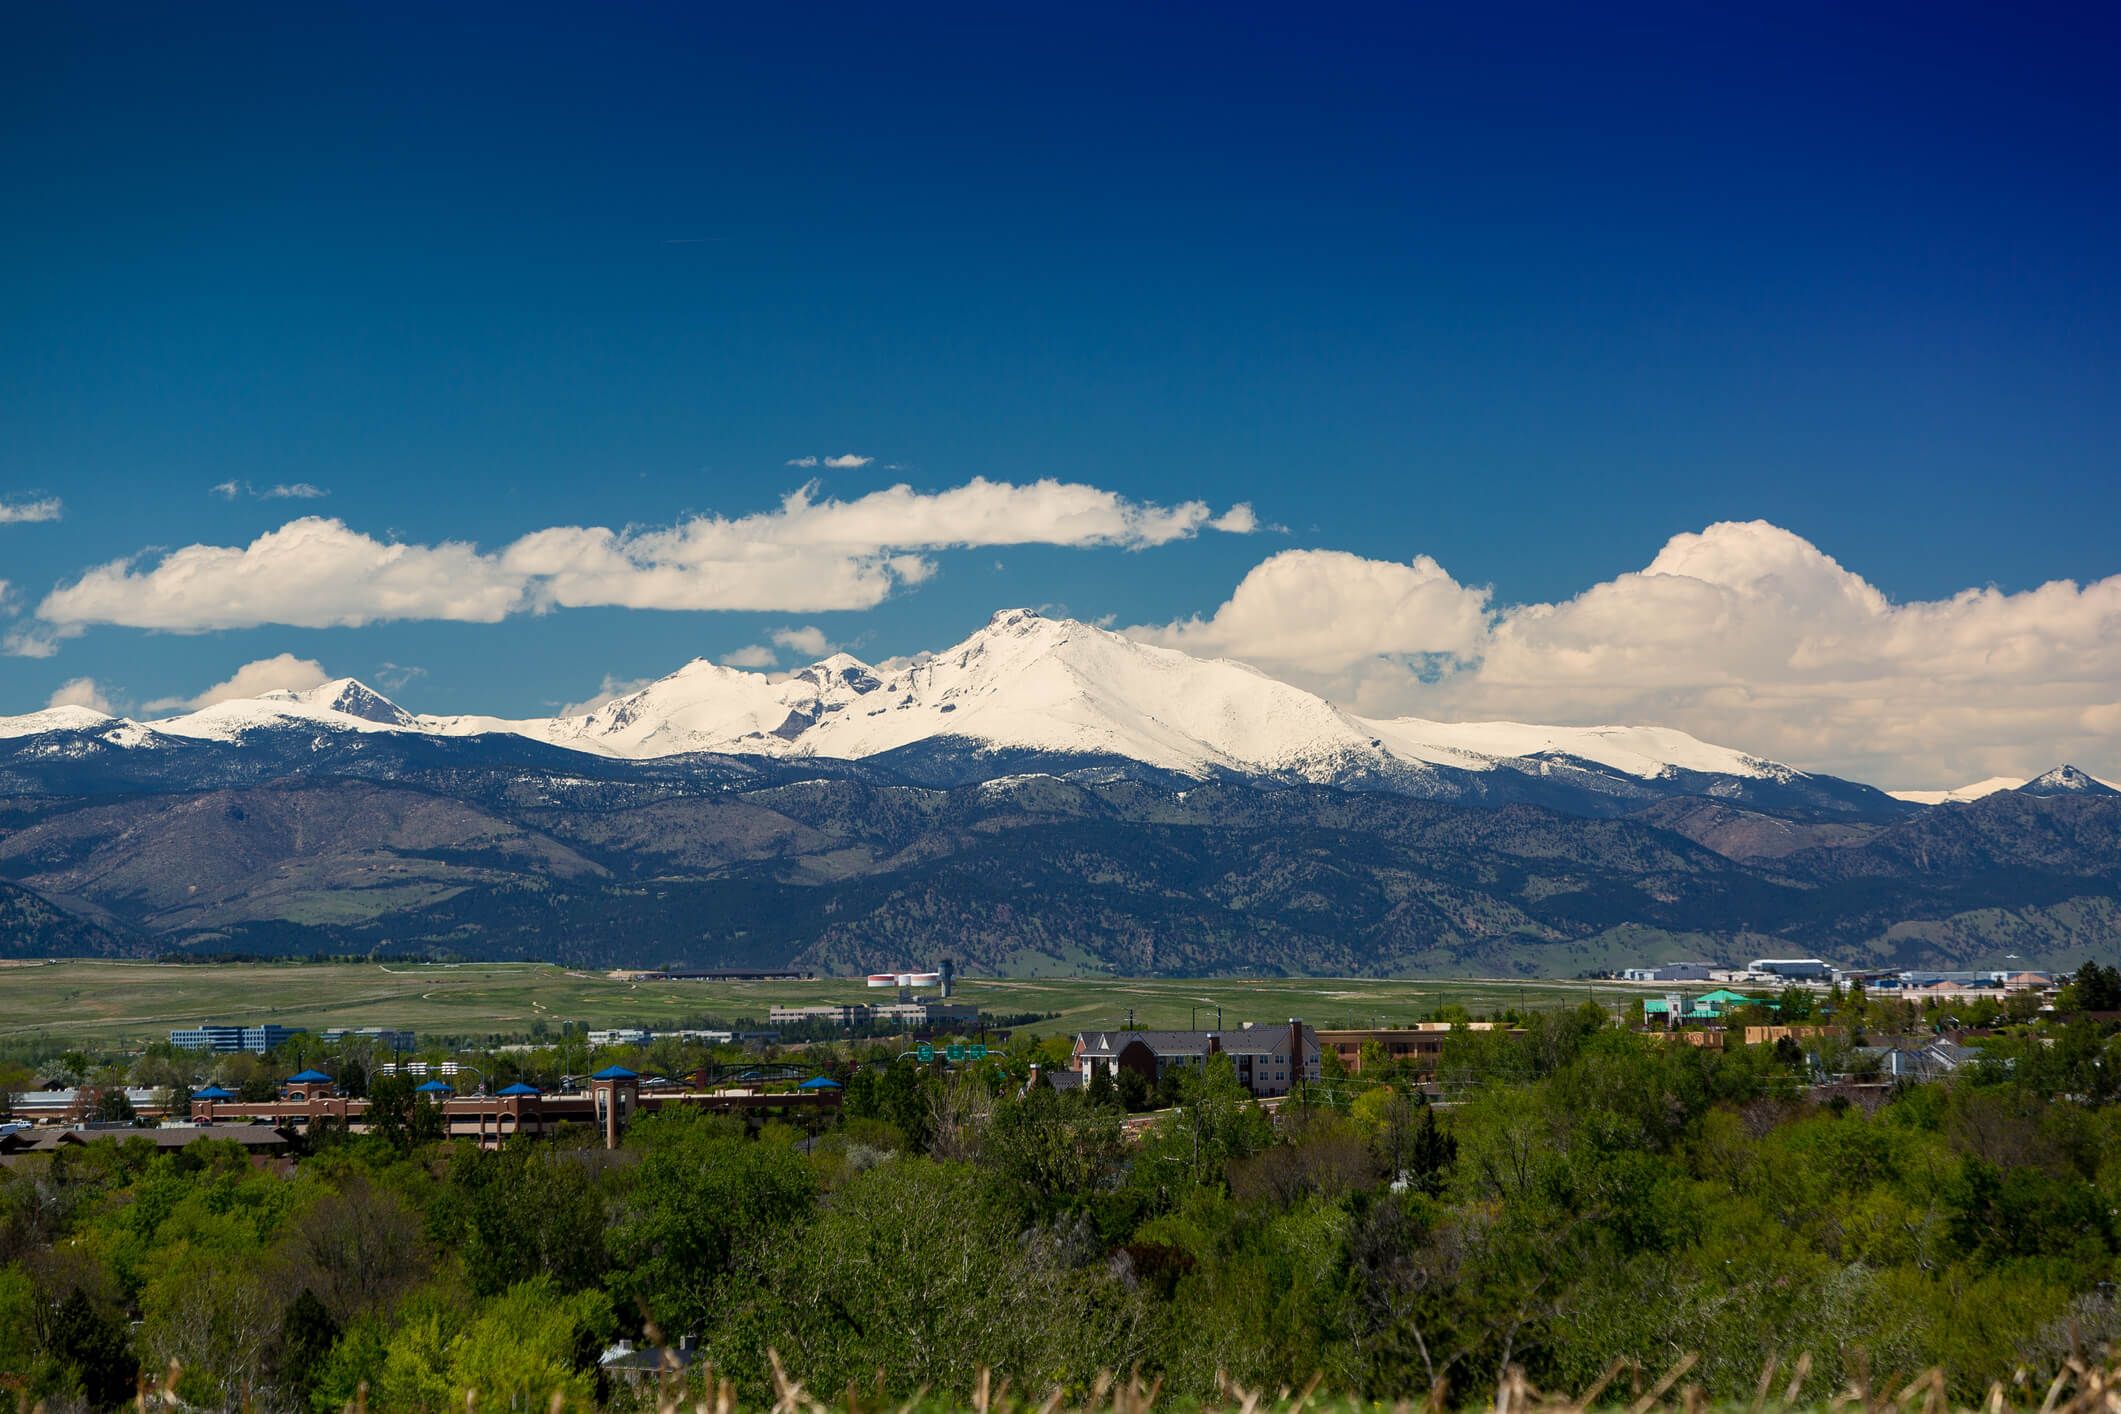
Last year on the 4th of May I think it was Pikes Peak got 4 feet of snow. What a relief it is to see the mountains blanketed with a thick layer of the white stuff again today!
Before we get started and before I get fined for using the data that I contribute to and have paid for 13 years to access. A disclaimer.
"Based on information from the REALTOR® Services Corp ("RSC"), for the period 2021(date) through 5/1/2026(date). RSC does not guarantee or is in any way responsible for its accuracy. Data maintained by RSC may not reflect all real estate activity in the market."
There are so many things we can talk about today market wise. Let's start with the foundation of any market. Supply.
Today we have 2,103 existing single family homes active on the market in El Paso County. Last month we started with 1,911 so a roughly 10% bump up in inventory. This is seasonality.
Last May we kicked off with 1,912 units.
May 2024...1,280 units
So 10% increase month over month is seasonality. A 10% increase year over year is fairly significant especially when you factor in the 49% increase the year before. That's a trend.
I'm going to show you two pictures that I made using showing data from showing time. This is data for the last 3 Aprils. The first pretty picture with a lot of green on it is going to show you the total number of showings across price points and chatGPTs interpretation of the data. Ready? Ok!
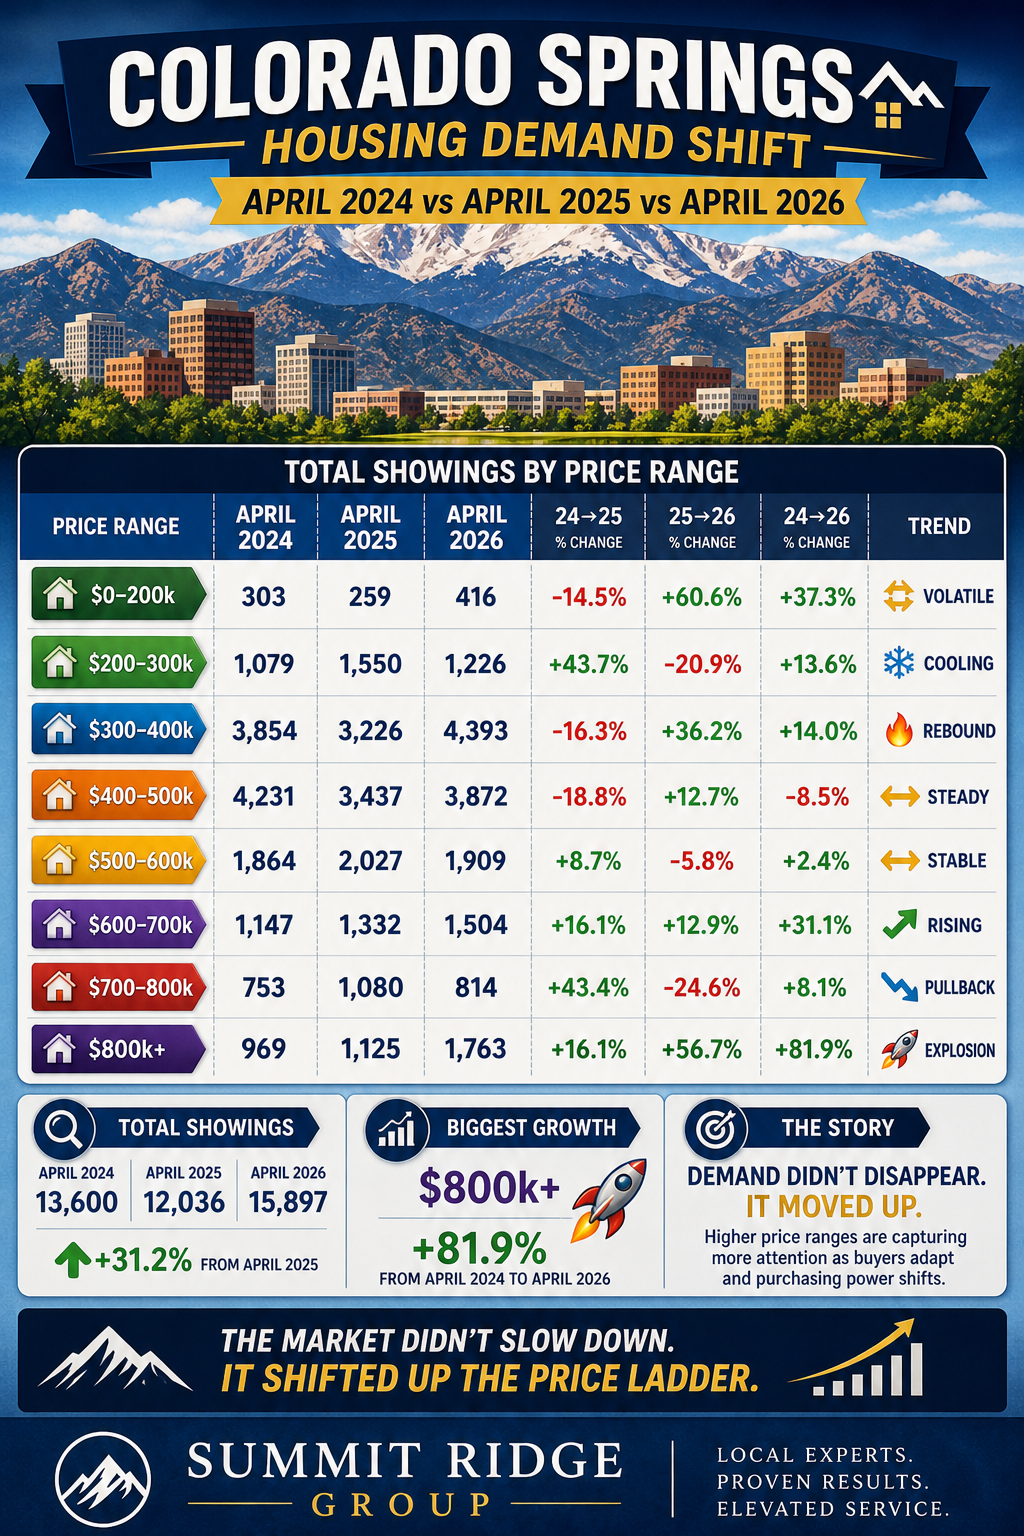
So if you take a look at this you might caption it with something like "the housing market in Colorado Springs is seeing growth in showing activity". Maybe you could spin it to say that demand is growing in Colorado Springs. What's missing for context is the amount of inventory that this is spread across. So yes indeed the total number of showings across Colorado Springs is up across most price points. But not as much as inventory is up. So if you're a seller this next visual is more representative of what your expectations should look like.
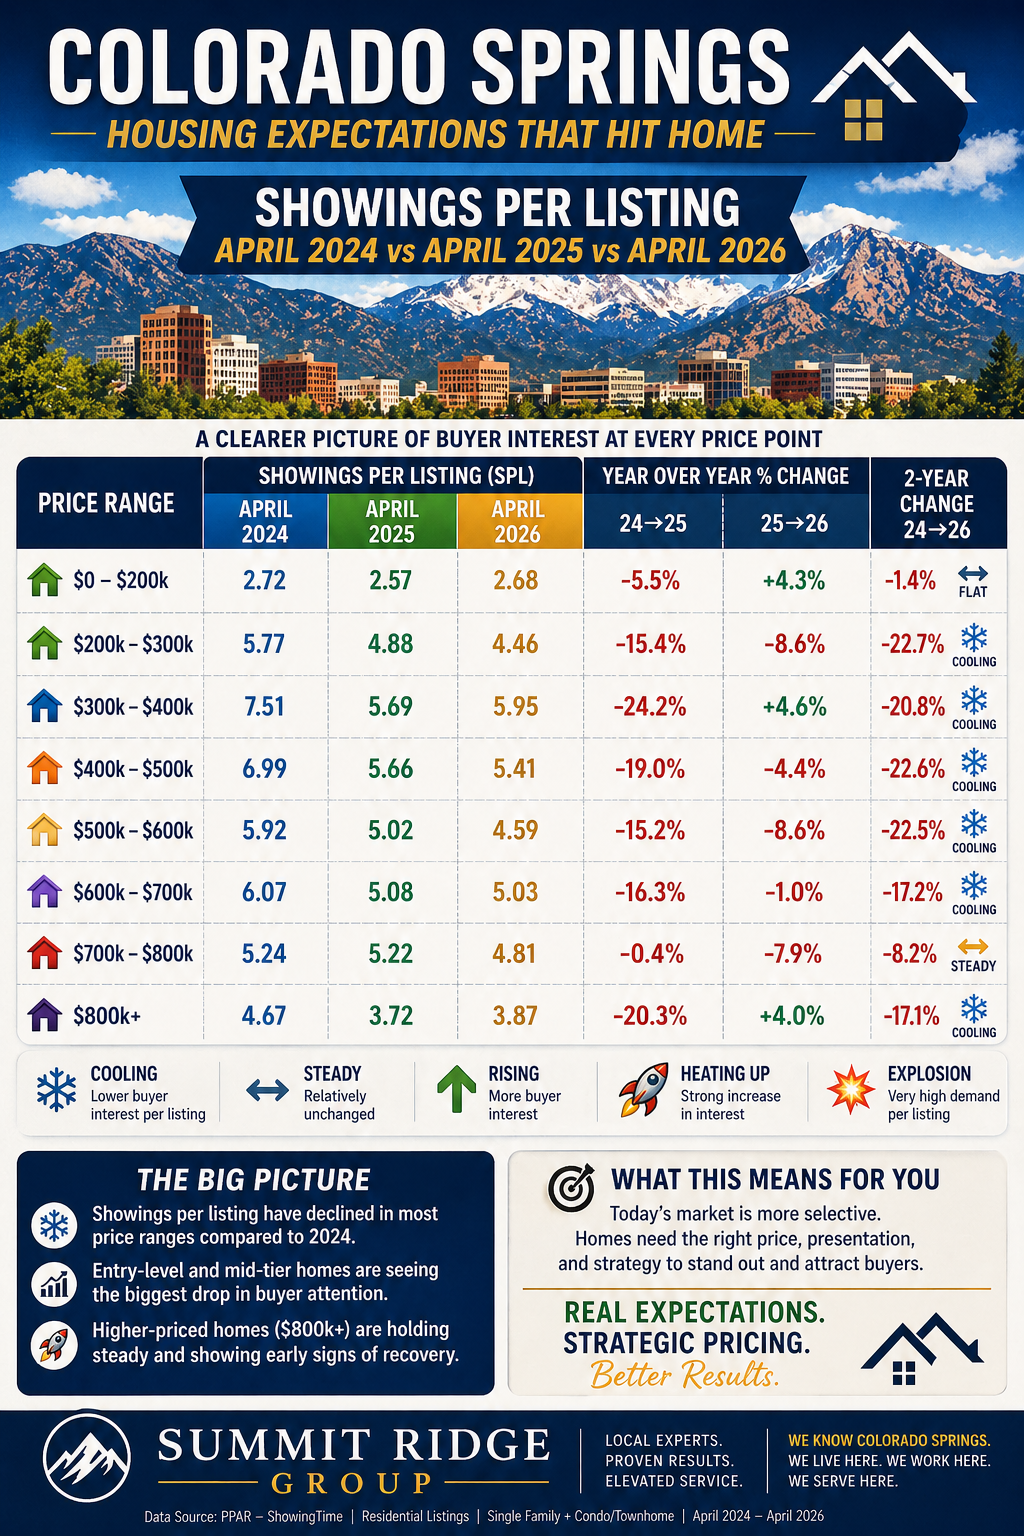
On this one chatGPT got the assignment correctly. This is showings per listing per month. You guys in real estate remember when we had to keep track of number of showings before and after lunch? This isn't that and we as an industry need to make sure sellers understand that going into the market.
You can see how with two sets of accurate data I could paint two completely different pictures of the market. It's ripping! It's crashing!
It's neither!
April 2025 we had 1,106 units sold. April 2024, 959 units. April 2023 1,090 units.
April 2026, stats are still being updated because it's May 1 but no less than 1,015 units sold. Pretty dang unremarkable and stable.
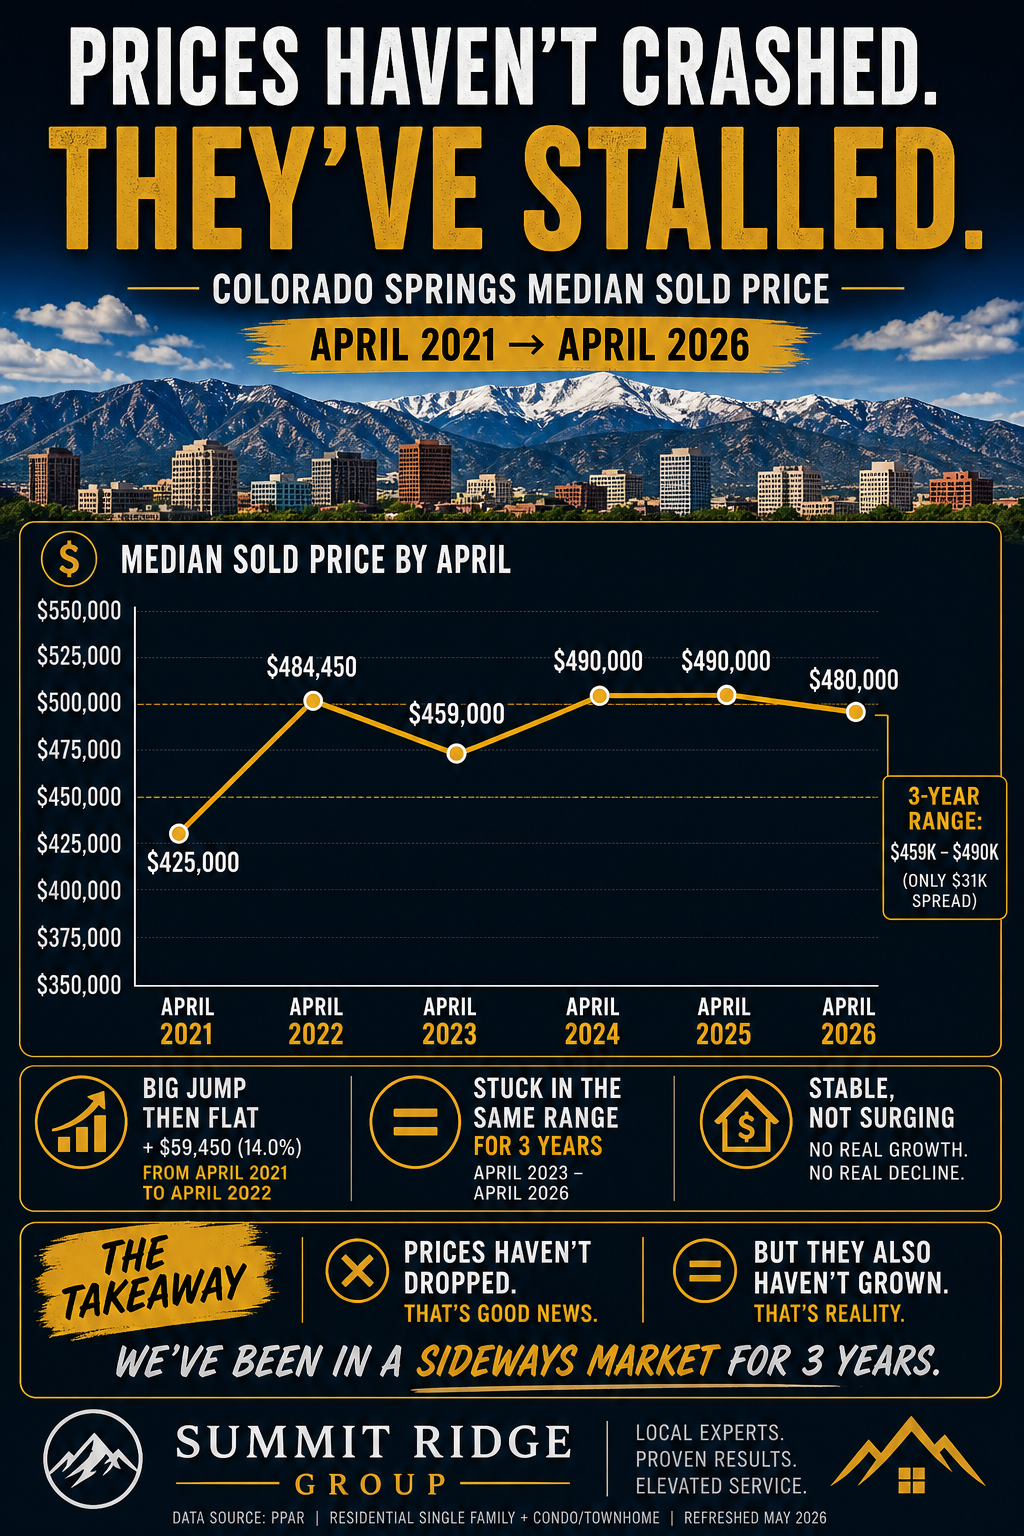
The one part that truly blows me away is how stable the median price has been since the run up of 2020-2022. Like look (and please forgive the AI here over 3 tries and me explaining exactly why the graph is off it still can't get it right. This is why I'm not entirely worried about AI taking my job since little tiny fuck ups cost tens of thousands of dollars in real estate :)) The data is right it's just that the most advanced machine learning can't figure out how to use the y and x axis to make a simple graph. More data centers to the rescue!
Also yes I'm going to let AI keep changing our slogan every single time until it hits a level of cockiness associated with agents I don't like, and then I'll force it to dial it back. I also love how we go from having the front range with a mid skyline to having the flatirons but no skyscrapers. We nailed that part AI.
So what does it all mean, man? It means that if you bought a house in the last 4 years, or refinanced it to full value, chances are you're fairly stuck. Maybe not fully stuck depending on condition and especially location. But sideways isn't great.
It also means that a huge amount of homeowners have massive equity positions that they're holding onto. According to an article I saw this morning and can't find now to cite 59.5% of Colorado home owners have equity positions of over 250k in their primary residences. This number is relevant as that is the cap for individual capital gains protection on primary residences. There is talk of raising that number at the Federal level, that would be kind of cool for home owners.
I'm going to try and talk about foreclosure data hopefully next month because once again the El Paso County Trustee hasn't published data since March 17.
Two more pictures and we're gonna wrap this up.
You-"iggy, how's the market?"
Me-"like for what? where?"
You-"like the housing market dude where is it going, when will the bottom hit and how do i clean up?"
Me-"Dude if I knew the answer to that I'd be rich AF with no cell phone my man"
But look. The housing market is a collection of stories. I told you the story of Colorado Springs so far. Our story mirrors Denver's story closer than anything else. But our story also mirrors the towns where housing ran up extremely fast prior to and during covid. Like the whole west coast basically, Nevada, AZ, Texas are all seeing similar trends to us. Florida is sinking....parum pum. But look at this from realtor.com
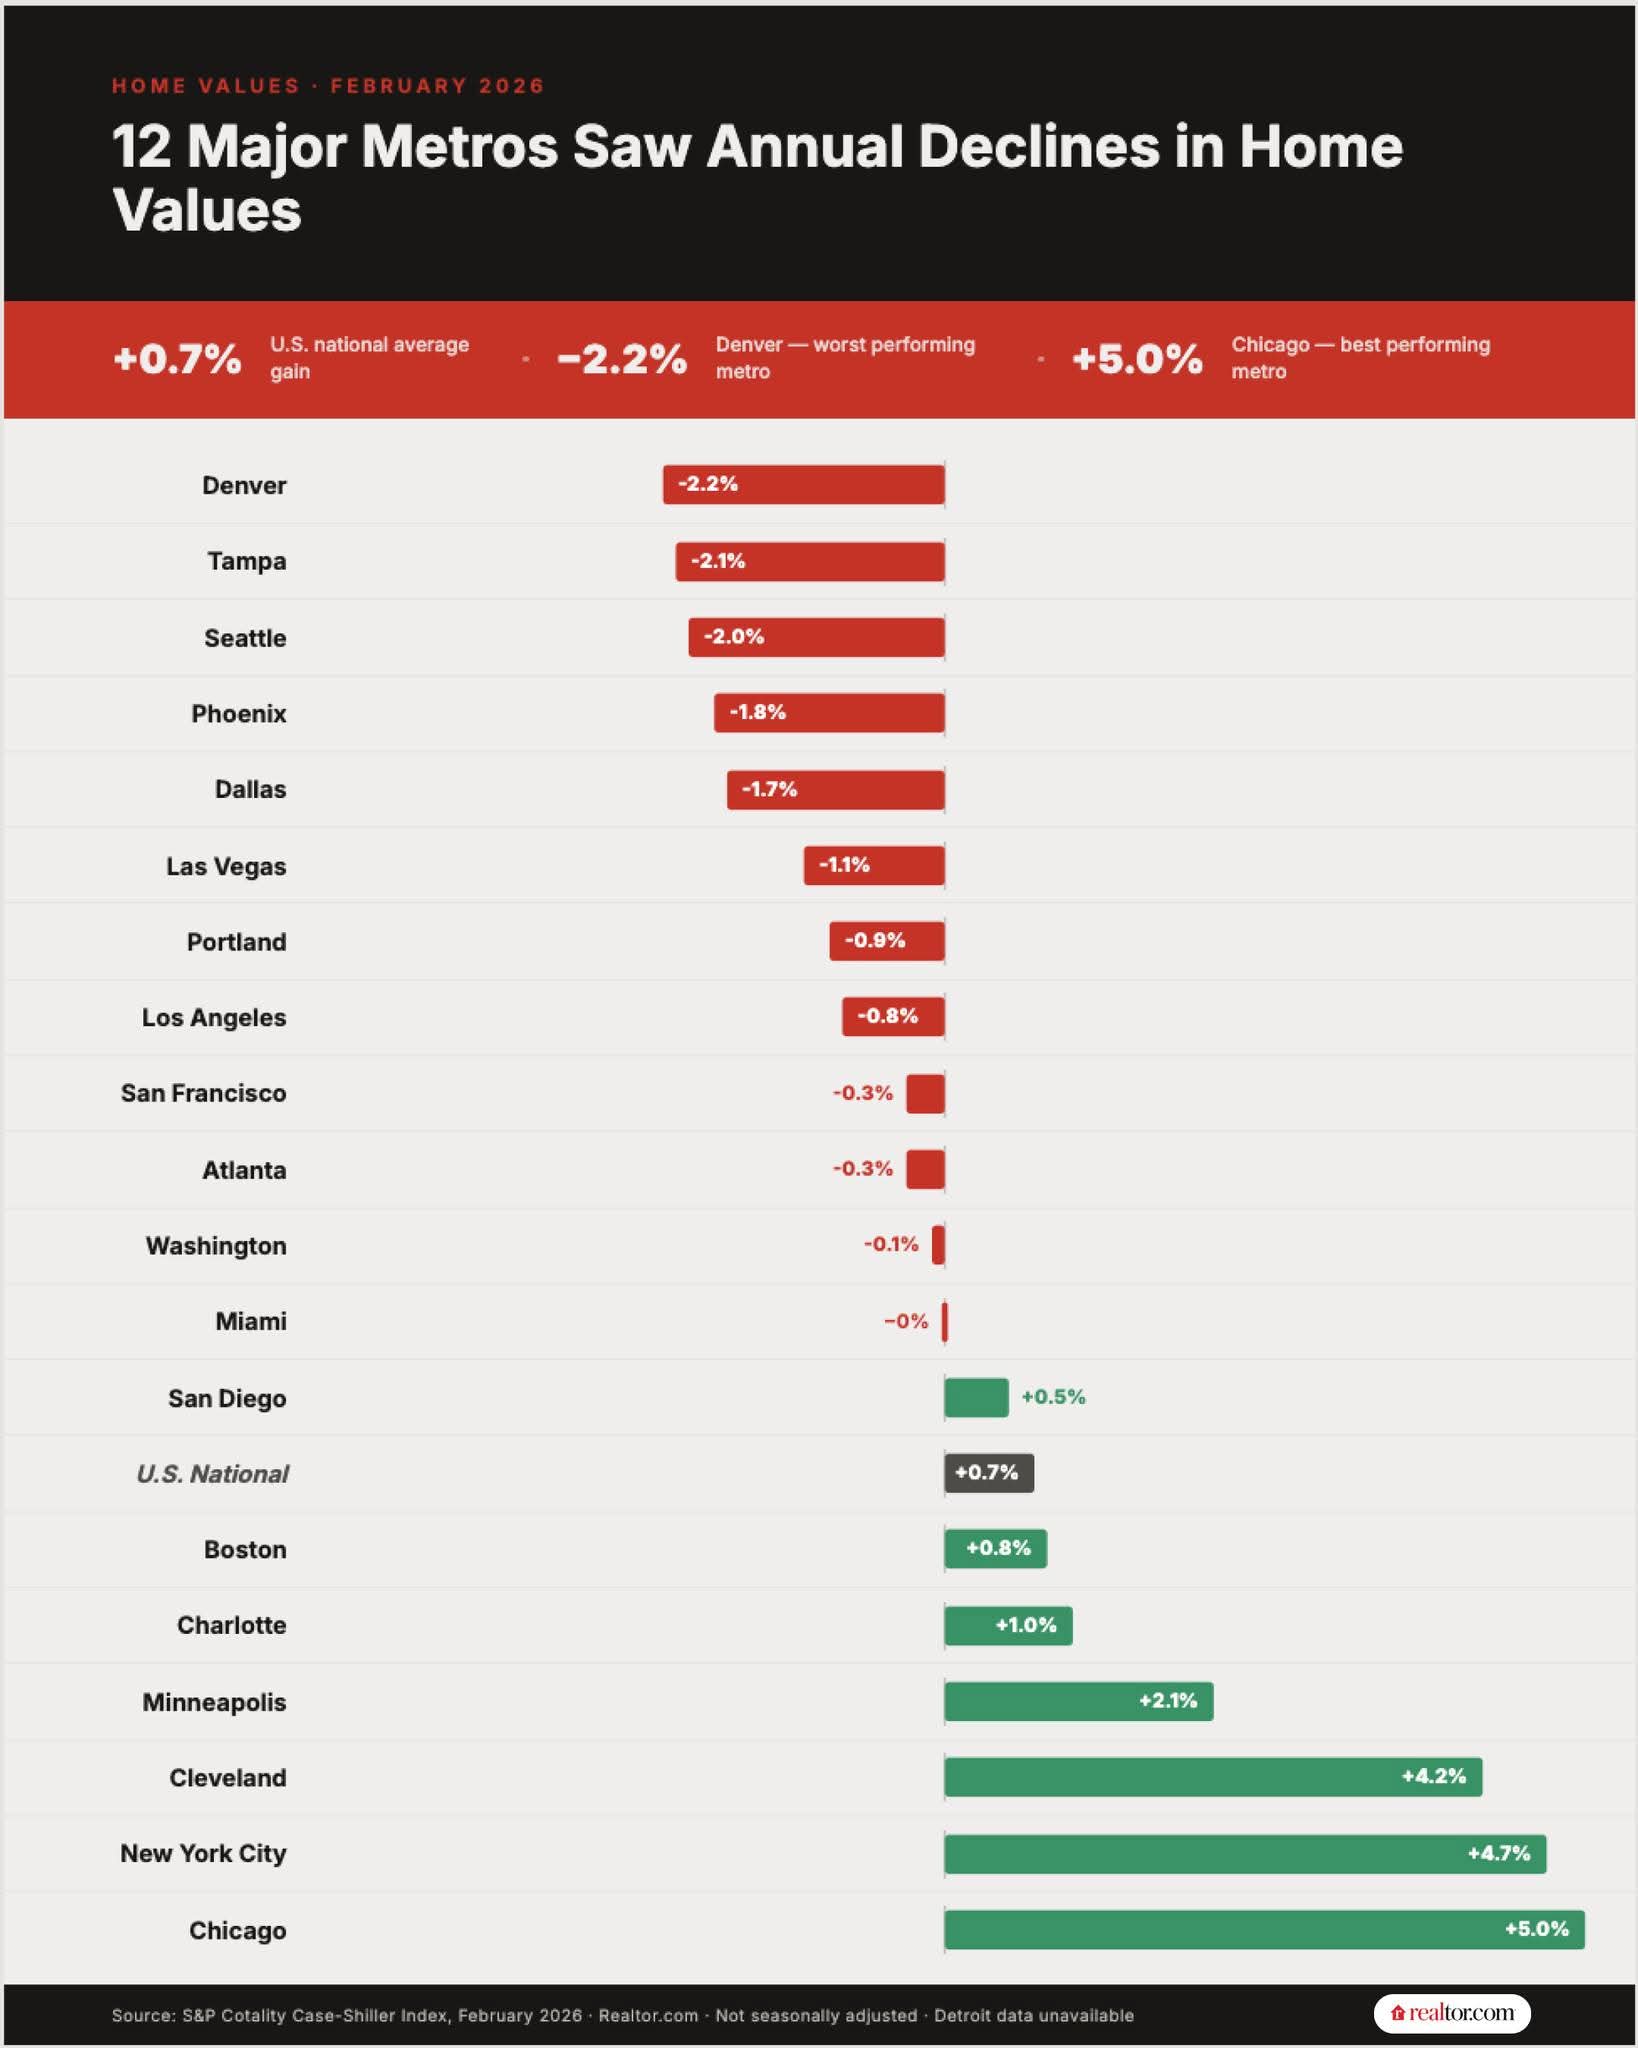
As I mentioned before the rust belt is killing it. New York and upstate New Jersey have bidding wars on properties. Meanwhile Denver is leading the way in price declines. Is it because Denver sucks? Yea for sure in part. Is it because Denver bubbled too high to quick? That's the bigger part of it.
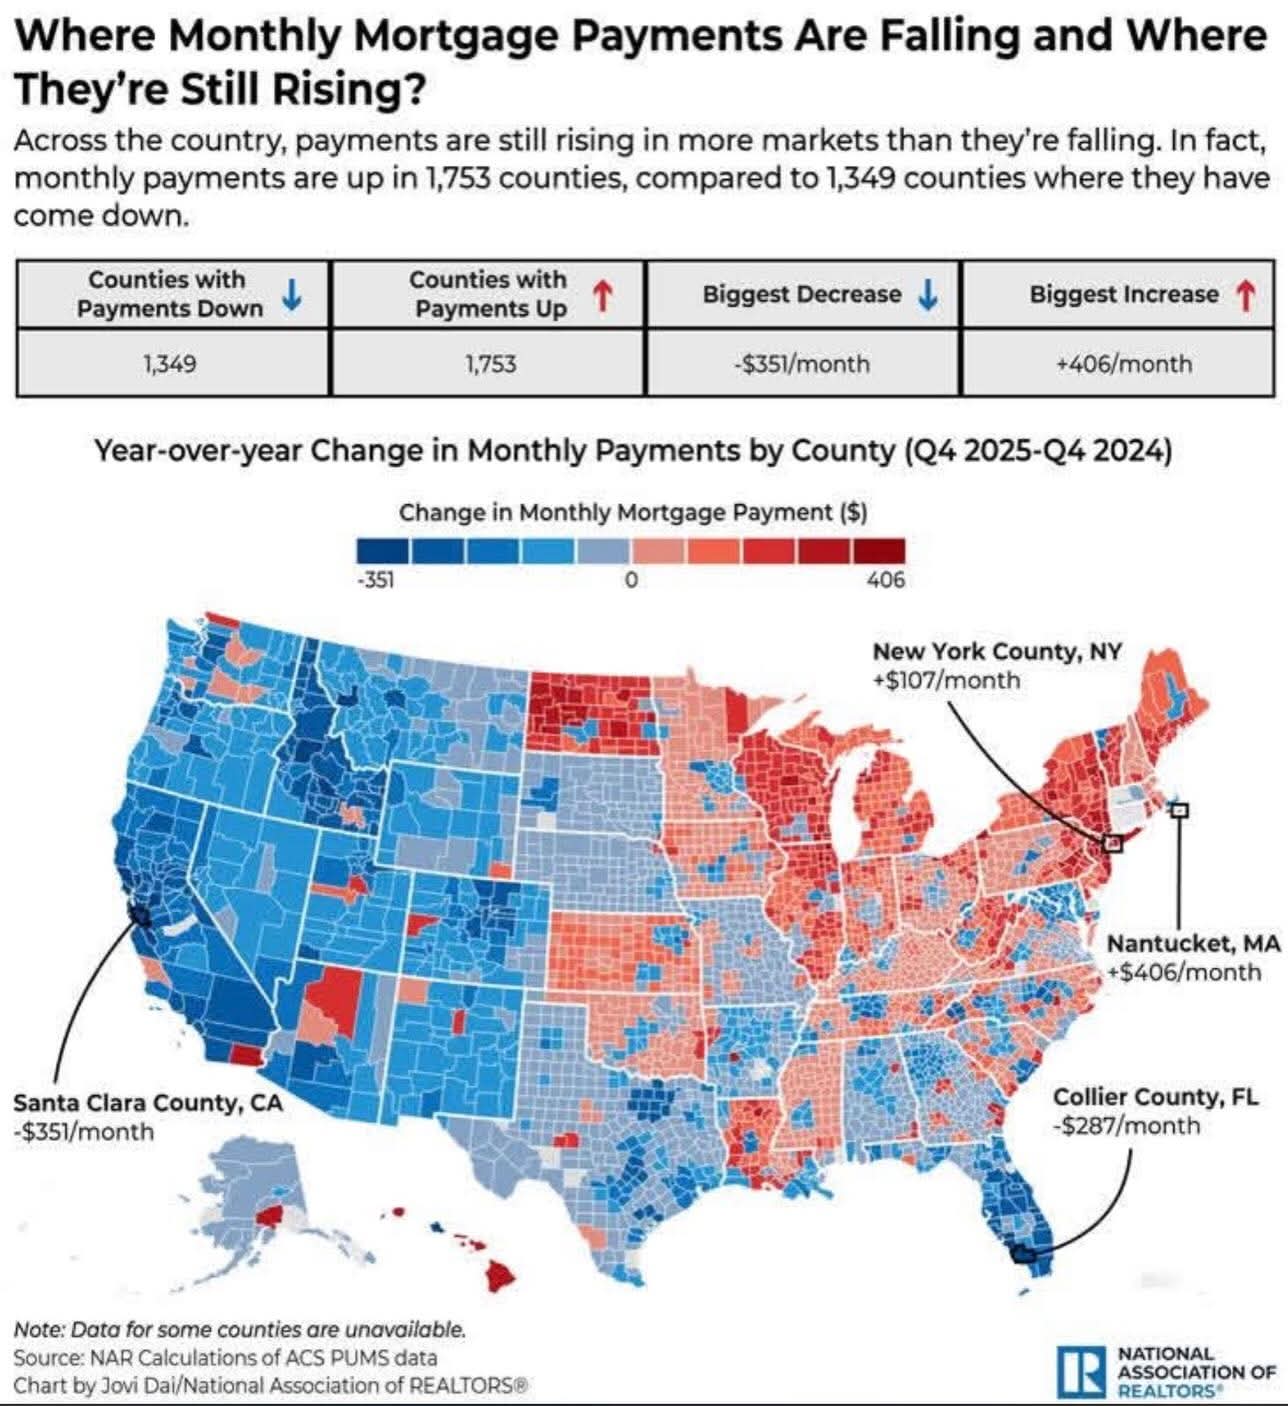
Now look at the same story but much more detailed in mortgage payments by county. Keep in mind the interest rates are the interest rates and there isn't a huge amount of volatility in rates across state lines. So where you see the blue house prices are falling. Where you see red they are rising. Because this reflects buyers' mortgage payments this reflects recent market sales and refinances.
I'm not sure what's going on in North Dakota man? Maybe the spike in oil prices is driving rough necks to buy houses?
So yea. The housing market is a collection of stories. The rust belt and north east is telling a whole different story than the mountain west and west coast. Florida tells a different story from Tennessee. And Chicago tells a different story than Denver. The moral compass of the story however is mostly based on affordability. With interest rates in the 6s buyers are seeking value. When interest rates were in the 2s buyers were chasing and speculating. With money tighter and the economy more subdued buyers are focused on value today rather than potential tomorrow.
My partner moved to Dallas. Where he now lives the median household income is over 180k a year. Here it's like around 90k. The median house there costs just under 600k. Here it's just under 500k. Yea property taxes are different and make up for some of the advantage. But still, double the household income and housing is maybe 30% more expensive. That matters.
Having lived in Colorado Springs for almost 31 years now I can say that the mountains are great. The trails are amazing. The camping is fantastic. I love it here. With that out of the way does any of that even matter if you have to work 60 hours a week just to pay your mortgage here? I also lived in Portland, OR when I was young. I had to work like 14-20 days in a row to keep up on my bills. The area is beautiful and I'll probably do more hiking there this summer than I did while living there.
Natural beauty draws people, 100%. But natural beauty is in abundance in America. Tennessee is beautiful, Utah is gorgeous, have you been the PNW????? California is a place that once you get away from the cities is stunning, Yosemite, Shasta, all dem thangs. We compete with all the areas. In order for us to have a healthy housing market, and same for basically the whole mountain west, our prices and our incomes need to be more inline with each other. They are not this out of balance in all the counties lit up in red in the animation above.
If you're thinking about selling this isn't the worst time to do it. Just be ready to compete and do our best to stand out in a positive way. Some areas this is very hard to do, other areas its easier. Keep in mind that this isn't 2021, but its not 2010 either.
If you're thinking about buying a house right now. Is this the best time ever? No. 2010 probably was and that's because nobody wanted to buy. As the sentiment shifts further into that direction you as a buyer need to think about being greedy when others are fearful. There are decent deals to be had today. The lower end of the market is much softer than the higher end due to the rate sensitivity of entry level buyers. We're seeing substantial price reductions and concessions on the lower end of the market while seeing stability in the upper sections.
At the end of the day, what's right for you? What are your goals? Where do you hope to be in 3, 5, 10 years? If your agent isn't asking you these questions and is chasing a paycheck, maybe fire them?


