

Published August 7, 2026
First Friday Update August 7, 2026


This summer has been hot and I'm super looking forward to hoodie weather, not gonna lie. Kids are back to school next week and that usually signals the ramp down in the real estate market that comes at the end of summer.
But first we get the last minute inventory bump. Right now we have 2,801 existing single family homes on the market in El Paso County. That is almost 200 more than this time last month. Generally speaking inventory should peak around August as a seasonality trait and if we see inventory numbers continue to grow into like October that will be a sign of a more serious supply/demand imbalance.
PPMLS wide we have just over 1,100 sales for July at a median sold price of just under $495,000. That stat alone suggests the market is ripping and healthy. But that is the survivor bias of compiling stats based on just the homes that sold.
In July of 2026 we had 590 houses get pulled from the market as cancelled or expired listings that did not sell. Year to date that number is 3,357 failed sales and I hate to tell you honestly that I contributed a few listings to that number.
Year to date failed sales over the last few years look like this
2025-2,851
2024-2,129
2023-1,754
2022-1,052
2021-767
The last time we had this many or more failed sales than year to date today was in 2011. That year to August 7 saw 4,190 homes that got pulled from the market without selling.
So yea if I tell you about the market based on just the houses that sold I could say something like we have less than a 3 month supply and houses are still selling near record highs. However that would be using only the winning part of the market to make that judgement. Truth is that for every 2 houses that sold last month another one failed to sell. And that third of the market isn't being factored into anything.
Interest rates remain higher than a lot of people care for. USAA right now is quoting rates like this. Notice the points.

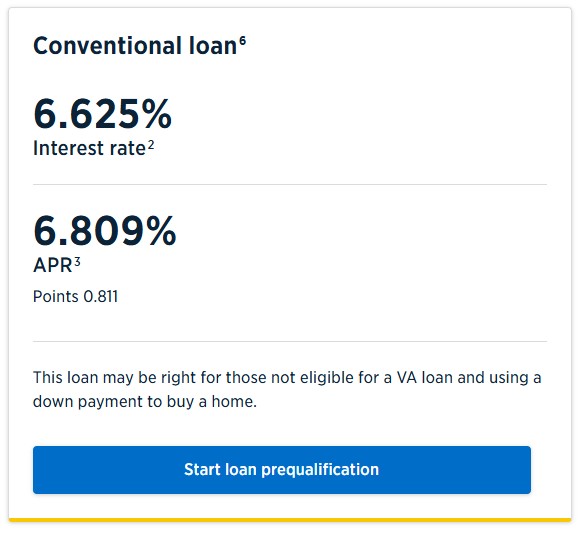
With the median sold price being around 500k 1.214 points is around $6,000 to get that rate and .811 is like $4000 for the conventional rate. So par rates are 7ish. That makes for some head scratcher mortgage payments fooooooooooooor sure.
Zooming out more to the macro we have more evidence of the obvious. The rich are indeed getting richer. Without any tin foil hats or elaborate conspiracy theories this can be explained in one graph.
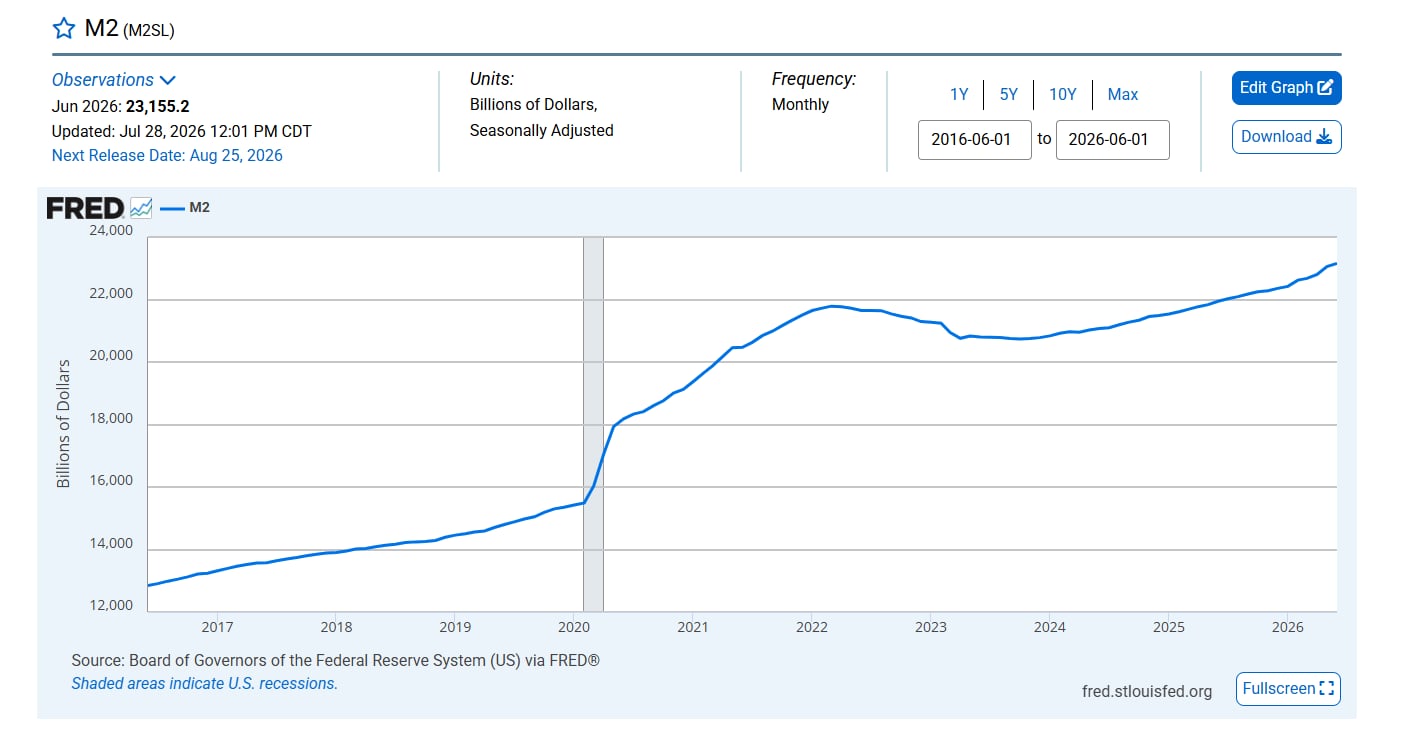
The money printer is once again going brrrrrr, but in a much more subtle way than 2020. I'm sure you can feel the effect of this everytime you go through the check out at the grocery store and find yourself wondering "wtf did I put in these 3 bags for $150"?
Honestly this graph of money supply is probably the most accurate and all encompassing story teller that we have. Because the rest of the data is questionable at best.
Jobs reports come out and make a splash in the market place. Today's came out showing 23,000 jobs lost while the expectation was a gain of 80k. These reports come out loudly but get revised a month or two later quietly. The revisions for the last couple months point to contraction in the jobs market.
However, the unemployment rate officially went down to 4.1% together with the labor participation rate. In English, the unemployment rate is low because indeed the people who want jobs have them and also because the people that stopped trying aren't counted.
It's like saying you only eat healthy food because you don't take into account all the unhealthy food you eat. Selective reasoning.
Money supply correlates with the price of housing almost perfectly. And for the homes that sell here locally we are seeing a sideways drift in prices just like the above graph shows. But due to the ample supply of housing buyers can be picky and the houses that do sell represent the best value, which is what today's buyers are seeking.
The supply of money is one important part and another equally important part is the velocity of money. How often does each dollar get spent? How many transactions is the money a part of? How quickly does it change hands?
.png)
The sharp drop in 2020 makes a ton of sense. You print off like 5 trillion dollars while telling everyone to stay inside and watch their favorite news channel. Americans personal savings rate at that point hits a record high because it was made kind of difficult to spend money. Supply goes up, spending goes down briefly, money velocity plummets.
The recovery that we're seeing in money velocity is important. Take the concept that right now there is more M2 money than ever before, like ever. Combine that with the fact that money is chasing a limited supply of goods and services at a faster pace. The result is inflation. Now we can blame this on oil, on Iran, on Crooked Joe, on China or whatever your personal favorite boogie man is.
The truth is so simple and obvious that we like to overlook it. We've been running Federal budget deficits pretty much non stop since.........leaving the gold standard.
.png)
This year we're about 1.8 trillion dollars short at the federal level. That will need to be printed. The price of goods and services will continue to rise with the dilution of the money supply.
Let's time travel a bit to get an idea of where we really are today.
1985-Gold costs about 330 bucks an ounce. Median house in the US costs are $85,000. Median household income is around $24,000. 258 ounces of gold buy a house. 3.55 years of income buys a house.
1995-Gold costs about $385 an ounce. Median house is around $135,000. Household income around $34,000. 350 ounces of gold to buy a house. 3.97 years of work.
2005- Gold around $475. Houses around $235,000. Income around $46,000. 494 ounces to buy a house, 5.1 years worth of income.
2015- Gold around $1,200. Houses around $290,000. Income at $57,000. 241 ounces of gold or 5.1 years of income to buy a house.
2025-Gold at all time highs lets call it $4500. Houses nationwide median around $410,000. Incomes roughly $85,000. Near record low of 91 ounces of gold to buy a house and just over 4.8 years of income.
From this we can say yes indeed the average American has to work almost 35% more to buy a house now than 40 years ago. True.
But let's add a layer and look at affordability over time as a percentage of household income.
1985-41% of household income went to the mortgage
1995-33%
2005-36%
2015-30%
2025-37%
The real conclusion is that things have been better and things have been worse. We have had better affordability in housing, and we have had worse. The only thing that truly stands out is that over 40 years
housing has gone up 4.8x
incomes have gone up 3.5x
gold has gone up about 14x
and the sp500 if you just parked $10,000 in it and reinvested dividends would give you back 1.06 million us for an over 10,000% return.
So look. You can't live inside of your stock portfolio. But you can indeed protect yourself from housing inflation by living in a house that you own. At some point you pay that thing off and win big over renting. Maybe rates drop and you get a lucky refi to lower your housing expense, another option renters don't have. Is your house going to outperform the stock market as an investment? Probably not. But can you spend the weekend fixing the deck in your Vanguard account? Also no.